ROGUE
INTELLIGENCE
The whole picture. Without all the work.
Overview
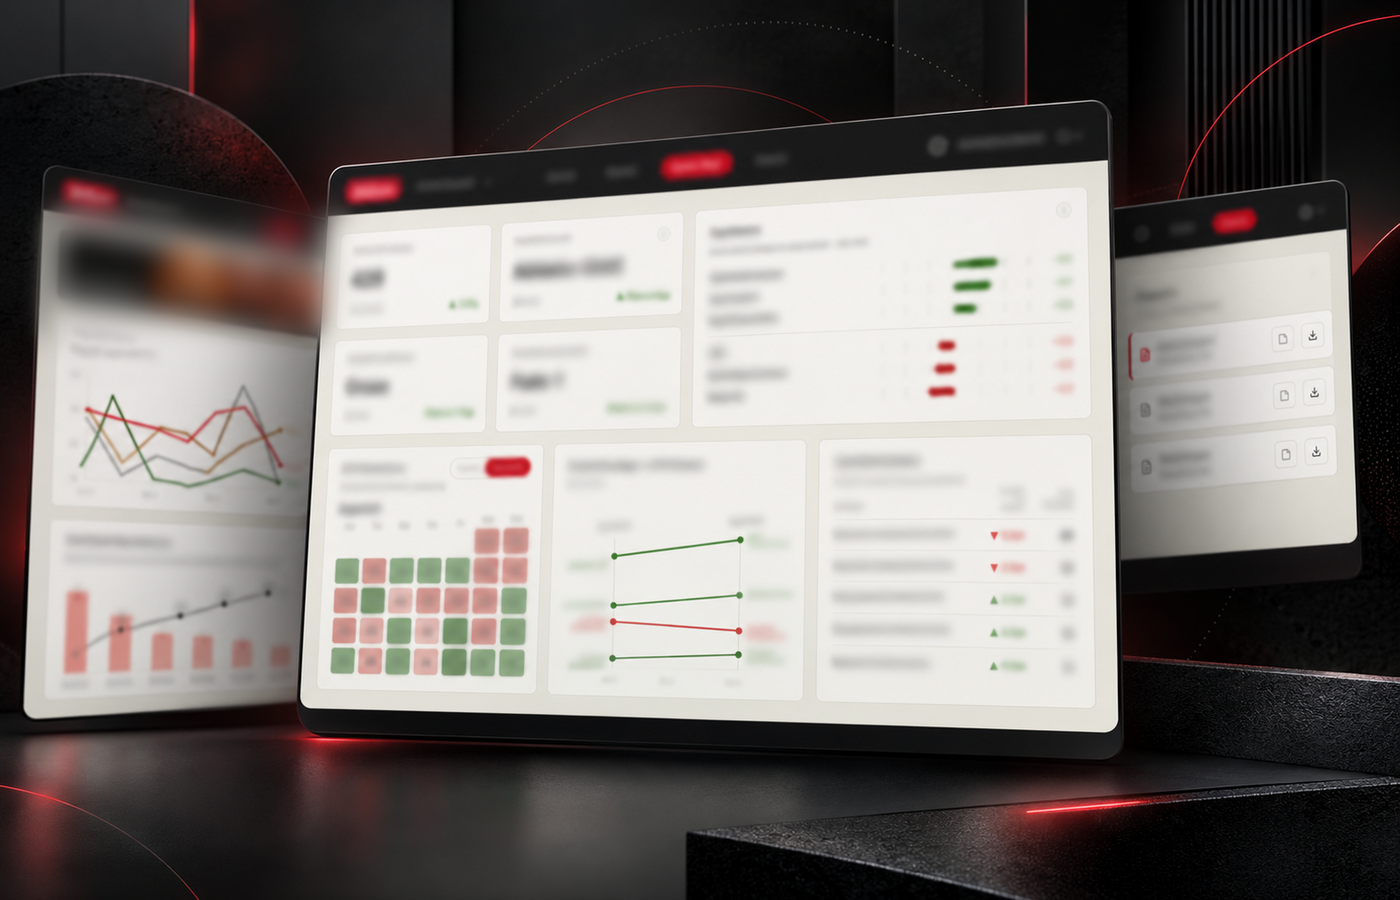
We bring the data that matters together in one place and make it easy to understand, without all the manual work. Our systems connect data from across the business, surface what’s changing and help teams see the bigger picture - so they can spend less time chasing numbers and more time acting on them.
Capabilities
DATA CONNECTIONS
Bring data from across the business into one place - connecting systems, platforms and sources that were never designed to work together.
AUTOMATED REPORTING
Turn repetitive reporting into an automated process, keeping the numbers current without the spreadsheets, exports and manual work.
CUSTOM INTELLIGENCE
Build dashboards and AI agents around the questions that actually matter to the business - not a pile of metrics nobody uses.
HUMAN INSIGHT
We don’t just hand over the data. We help make sense of what’s changing, what matters and where the opportunities are.
How we work
- P1
Decision mapping
We inventory the recurring decisions and the data each one truly needs.
- P2
Source assessment
An honest read on data quality, gaps, and what must be fixed upstream.
- P3
Model and build
Warehouse, transformations, and tested metric definitions.
- P4
Adoption
We stay until the reports are used in the meeting, not just delivered.
What clients get
Talk to us about
Rogue INTELLIGENCE
Drowning in spreadsheets? Let’s turn your data into decisions.
LET'S TALK